In the 2025 FoRSE Annual Summary (page 22), we presented visualizations of the average length of stay (LOS) across eight levels of care. Prior years’ FoRSE reports filtered out patient episodes with zero days recorded in each level of care, such that the reported average lengths of stay did not include individuals who did not receive services in that level, but the data shown in the 2025 Summary were unfiltered.
We have now re-run the analyses with the relevant filter applied. Now, as in similar years, we include only patient episodes with one or more calendar days in each level of care.
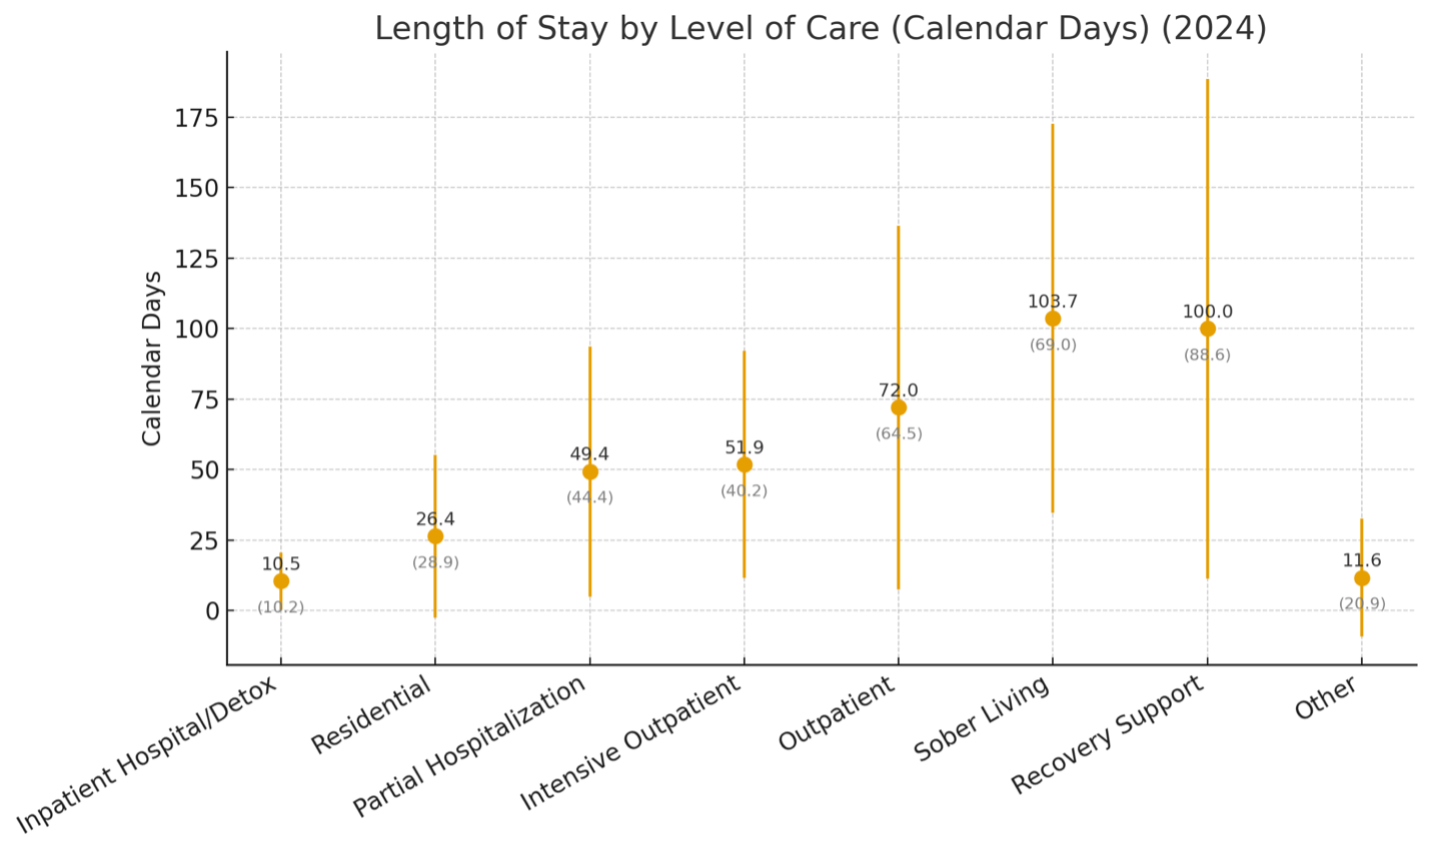
The updated graphs shown below reflect this more accurate representation of FoRSE data. Average (mean) days spent in each level of care, among patients who spent at least one day in that level, are indicated in these graphs (with standard deviations in parentheses).
- The first graph shows average length of stay by level of care for patient episodes representing admission to treatment between 2020 and 2024 (n = 184,436 across 97 distinct organizations).
- The second graph shows the same measure for 2024 admissions only (n = 79,745 across 92 distinct organizations).
These updated visualizations provide a clearer and more meaningful look at how patients engage in different levels of care. By continually refining our analytic processes, FoRSE remains committed to transparency and to producing the highest-quality outcomes data for the field of addiction treatment.